JMeter HTTP Proxy Server
To set up a JMeter HTTP Proxy Server we
can start off with a new JMeter project. I simply fired up JMeter and started
to work on the empty project it started with. I wanted the recording from the
HTTP Proy Server to go into my workbench rather than clutter up the Test Pan.
To achieve this, right click on the WorkBench icon in the left hand panel and
move through Add, Non Test Elements, HTTP Proxy Server.

Now that the proxy exists it is necessary
to configure it. I set mine up to Capture HTTP Headers and to Set Keep Alive.
Keep alive means that for each session JMeter will try and reuse the socket it
creates to talk to the server. In my case, the socket will be closed by TAG
after a configured time, but most of the time one socket will be used for an
entire session. This closely resembles the behaviour of most browsers. Though,
in truth, browsers often use more than one socket to download on session. We
can look into that in a later post.

Other settings for the proxy which I used were to make it record the conversation ender the server element “Target Controller: Work Bench->HTTP Proxy Server”. Also you want to ensure that it is set not to group samplers. It is very important to make note of the listening port, in this case it was 8080.
Next I set up IE7; IE6 is almost identical. For JMeter to listen into the chatter between the server and the browser, it is necessary to make the browser connect to JMeter rather than directly to the server. This is done from the Tools, Internet Options menu.

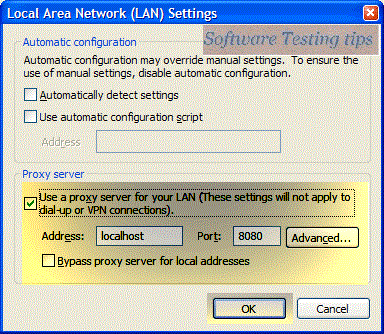
On the Internet Options panel, the Connections tab leads to the LAN settings and from there to the proxy settings

In my case I had JMeter running on the same machine as the browser. This meant that the browser could see the JMeter proxy server on the local ‘loopback’ interface. This is called LocalHost on most Windows machines. To get the browser to talk to the proxy server I checked the ‘Use a proxy server’ check box. Then I put in ‘LocalHost’ as the server and 8080 as the port. The port is the one that was set in the JMeter HTTP Proxy Server setup earlier.

The Thread Group control threads of parallel execution of the Test Plan. You can think of each thread as a separate user. In the above picture, I right clicked on my Test Plan and went to Add/Thread Group. Finally - to get the process rolling you must start the Proxy Server:


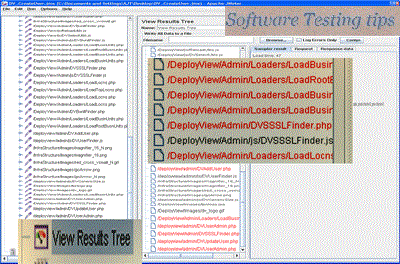
I have found that JMeter sometimes makes mistakes. I have raised with the community and hopefully it can be resolved. In the mean time, it is worth looking through the results of the HTTP Proxy Server and checking for obvious errors (like that in the picture above where 618961df was appended the target URL).

In my case I had JMeter running on the same machine as the browser. This meant that the browser could see the JMeter proxy server on the local ‘loopback’ interface. This is called LocalHost on most Windows machines. To get the browser to talk to the proxy server I checked the ‘Use a proxy server’ check box. Then I put in ‘LocalHost’ as the server and 8080 as the port. The port is the one that was set in the JMeter HTTP Proxy Server setup earlier.

Now we are in a position to start recording sessions! But that is not what I actually did. I first added a thread Group to my Test Plan. We will use it later, but as all the pictures have it in at this point, I discuss how to add it right now.

The Thread Group control threads of parallel execution of the Test Plan. You can think of each thread as a separate user. In the above picture, I right clicked on my Test Plan and went to Add/Thread Group. Finally - to get the process rolling you must start the Proxy Server:

Then you use your browser to browser the site as you would normally. In my case I logged onto DeployView, went to user management, added a new user and then updated their details. This process was important for working each part of a web application test plan. The logging on used cookies, the form submissions used CGI encoding and the updating of the added user meant having to extract the user identifier from the result of one request and post it as part of the CGI variables for another.

As you browse then Proxy will record the all the page requests that are occurring. By expanding the tree beneath the HTTP Proxy Server tab in the left pane, you can see the individual requests. Once you have made a recording – remember to turn off the proxy server! Each request from the browser gets recorded as an HTTP Request sampler. If you click on the sampler you can see the settings that JMeter has recorded

Also there may be some requests that get made in which you genuinely have no interest. In this example, I found that some debug code was making calls to the JSErrorLogger.php web service. This was not part of a production system, so I did not want theses requests in the Test Plan. Also, there might be some requests at the front and end of the browsing you did that you do not want in the test plan. No problem, this is one of the reasons we have a Work Bench! Click and drag (one at a time or use shift click) the requests you DO want up to the Test Plan. When you drop them on the Test Plan it will ask if you want them to be added before, after or as a child. You want them added as a child. At this point your test plan is nearly ready to run for the first time. I would strongly suggest saving it; crashes happen.Just before running the script I added in a TreeView listener. This oddly named listener keeps a record of every request and response. It is not much use in load testing as it soon overloads, but it is just the ticket when testing a script. At this point I also added in an Aggregate Graph listener which is key to load testing.


Design
Functionality
Here is a description of the functionalty.
Name – name for the sample. This is the same as all jmeter samplers.
Package Filter – provides a way to filter the classes by package name.
Classname – the name of the class to test. The sampler will scan the jar files in
jmeter/lib/ext and jmeter/lib/junit for classes extending junit's TestCase.
Constructor String – a string to pass to the string constructor of the test class.
Test Method – the name of the method to test in the sampler.
Success message – a descriptive message indicating what success means.
Success code – an unique code indicating the test was successful.
Failure message – a descriptive message indicating what failure means.
Failure code – an unique code indicating the test failed
Error message – a description for errors
Error code – some code for errors. Does not need to be unique
Do not call setUp and tearDown – set the sampler not to call setUp and tearDown. By
default, setUp and tearDown should be called. Not calling those methods could affect the
test and make it inaccurate. This option should be used with caution. If the selected method
is oneTimeSetUp or oneTimeTearDown, this option should be checked.
Append assertion error – By default, the sampler will not append the assert failures to the
failure message. To see the message in the result tree, check the option.
Append runtime exception – By default, the sampler will not append the exceptions to
the failure message. To see the stacktrace, check the option
The current implementation of the sampler will try to create an instance using the string
constructor first. If the test class does not declare a string constructor, the sampler will look
for an empty constructor. Example below:
Empty Constructor:
public class myTestCase {
public myTestCase() {}
}
String Constructor:
public class myTestCase {
public myTestCase(String text) {
super(text);
}
}

Usage
Here is a short step-by-step.
1. write your junit test and jar the classes
2. copy and paste the jar files into jmeter/lib/junit directory
3. start jmeter
4. select “test plan”
5. right click add -> thread group
6. select “thread group”
7. right click add -> sampler -> junit request
8. enter “my unit test” in the name
9. enter the package of your junit test
10.select the class you want to test
11.select a method to test
12.enter “test successful” in success message
13.enter “1000” in success code
14.enter “test failed” in failure message
15.enter “0001” in failure code
16.select the thread group
17.right click add -> listener ->view results tree
One benefit of the Junit sampler is it allows the user to select any method from a variety of
unit tests to create a test plan. This should reduce the amount of code an user needs to write
to create a variety of test scenarios. From a basic set of test methods, different sequences
and tests can be created using Jmeter's GUI.
For example:
Test Plan1
• TestCase1.testImportCustomer
• TestCase2.testUpdateRandomCustomer
• TestCase1.testSelect100
• TestCase2.testUpdateOrder
• TestCase1.testSelect1000
TestPlan2
• TestCase1.testImportCustomer
• TestCase1.testSelect100
• TestCase1.testSelect1000
• TestCase2.testAdd100Customers
General Guidelines
Here are some general guidelines for writing Junit tests so they work well with Jmeter. Since
Jmeter runs multi-threaded, it is important to keep certain things in mind.
1. Write the setUp and tearDown methods so they are thread safe. This generally means
avoid using static memebers.
2. Make the test methods discrete units of work and not long sequences of actions. By
keeping the test method to a descrete operation, it makes it easier to combine test
methods to create new test plans.
3. Avoid making test methods depend on each other. Since Jmeter allows arbitrary
sequencing of test methods, the runtime behavior is different than the default Junit
behavior.
4. If a test method is configurable, be careful about where the properties are stored. Reading
the properties from the Jar file is recommended.
5. Each sampler creates an instance of the test class, so write your test so the setup happens
in oneTimeSetUp and oneTimeTearDown.
6. If you select a class and no methods show up, it means the sampler had a problem
creating an instance of the test class. The best way to debug this is to add some
System.out to your class constructor and see what is happening.


DeployView uses cookies to maintain the user session once the user is logged on. So we need to add in a Cookie Manager. This will store the any Cookies associated with a thread. Remember that in JMeter threads are like users, so if you have 4 threads then you will have the same as 4 separate browsers connected to the server, and hence 4 separate cookies.

In my test I wanted each run through the test plan to be like a new login so I clicked ‘Clear cookies each iteration?’

This time it worked – no red! Do you remember that we are working through an example off creating a user and then updating that user? Well we have gotten most of the way. However, this test plan as it stands does not update the user it creates, it keeps updating the user that was created when the session was recorded by the HTTP Proxy Server. Extracting a variable from a response is the wait to finish off our goal here. To achieve this I had to know a little bit about the web application I was testing. I knew that the new user’s id would be reported in the response from the first call to DVAddUser.php (we like to keep names nice and obvious!) To extract data like this we need to add a Regular Expression Extractor, I will show how I did this in a minute. First I had to find the appropriate page. To do that I selected my handy View Results Tree and by searched for the page request I in the left panel of JMeter. Once I had what I thought was the correct request I could than line that up with the View Results Tree and see if the data passing back and forth was what I expected it to be.

After a lot of squinting at the results in the right hand pane, I finally found the result I was looking for:

JMeter finds values in responses using regular expressions. Now that I knew which request/response I was looking for and what in the response I was looking, I could add a Regular Expression Extractor.

I set up the extractor to look in the response body. I then gave it a reasonable name “AddUser” and set its value to the match to the contents of the value clause of the regex. The reason that I knew this regex would always find the value I wanted is that the Id of the HTML element is unique. So, as long as the page was not corrupt, I could use the definition of the Id as “uid” as an anchor to fund the appropriate value. The match inside the brackets then is forwarded to the "template" setting in the extractor. Just to be sure I set the “Default” value to something that would be obvious if the extraction went wrong; in DeployView there should never be a user with an Id of -1.

Placing the extracted value in the update request was the next step.

Junit Sampler
This post attempts to explain the basic design, functionality and usage of the new Junit
Sampler for Jmeter. The sampler was introduced in 2.1.2 release of Jmeter. Earlier releases
do not have the sampler.
Sampler for Jmeter. The sampler was introduced in 2.1.2 release of Jmeter. Earlier releases
do not have the sampler.
Design
The current implementation supports standard Junit convention and extensions, like
oneTimeSetUp and oneTimeTearDown. Other features can be added on request. The
sampler works like the JavaSampler with some differences.
1. rather than use Jmeter's test interface, it scans the jar files for classes extending junit's
TestCase class. This means any class or subclass.
2. Junit test jar files are copied to jmeter/lib/junit instead of jmeter/lib
3. Junit sampler does not use name/value pairs for configuration. The sampler assumes
setUp and tearDown will configure the test correctly. Note: setUp and tearDown
methods must be declared public, so that Jmeter can use it.
4. The sampler measures the elapsed time only for the test method and does not include
setUp and tearDown.
5. Each time the test method is called, Jmeter will pass the result to the listeners.
6. Support for oneTimeSetUp and oneTimeTearDown is done as a method. Since Jmeter is
multi-threaded, we cannot call oneTimeSetUp/oneTimeTearDown the same way maven
does it.
7. The sampler reports unexpected exceptions as errors.
Functionality
Here is a description of the functionalty.
Name – name for the sample. This is the same as all jmeter samplers.
Package Filter – provides a way to filter the classes by package name.
Classname – the name of the class to test. The sampler will scan the jar files in
jmeter/lib/ext and jmeter/lib/junit for classes extending junit's TestCase.
Constructor String – a string to pass to the string constructor of the test class.
Test Method – the name of the method to test in the sampler.
Success message – a descriptive message indicating what success means.
Success code – an unique code indicating the test was successful.
Failure message – a descriptive message indicating what failure means.
Failure code – an unique code indicating the test failed
Error message – a description for errors
Error code – some code for errors. Does not need to be unique
Do not call setUp and tearDown – set the sampler not to call setUp and tearDown. By
default, setUp and tearDown should be called. Not calling those methods could affect the
test and make it inaccurate. This option should be used with caution. If the selected method
is oneTimeSetUp or oneTimeTearDown, this option should be checked.
Append assertion error – By default, the sampler will not append the assert failures to the
failure message. To see the message in the result tree, check the option.
Append runtime exception – By default, the sampler will not append the exceptions to
the failure message. To see the stacktrace, check the option
The current implementation of the sampler will try to create an instance using the string
constructor first. If the test class does not declare a string constructor, the sampler will look
for an empty constructor. Example below:
Empty Constructor:
public class myTestCase {
public myTestCase() {}
}
String Constructor:
public class myTestCase {
public myTestCase(String text) {
super(text);
}
}

By default, Jmeter will provide some default values for the success/failure code and message.
Users should define a set of unique success and failure codes and use them uniformly across
all tests.
Users should define a set of unique success and failure codes and use them uniformly across
all tests.
Usage
Here is a short step-by-step.
1. write your junit test and jar the classes
2. copy and paste the jar files into jmeter/lib/junit directory
3. start jmeter
4. select “test plan”
5. right click add -> thread group
6. select “thread group”
7. right click add -> sampler -> junit request
8. enter “my unit test” in the name
9. enter the package of your junit test
10.select the class you want to test
11.select a method to test
12.enter “test successful” in success message
13.enter “1000” in success code
14.enter “test failed” in failure message
15.enter “0001” in failure code
16.select the thread group
17.right click add -> listener ->view results tree
One benefit of the Junit sampler is it allows the user to select any method from a variety of
unit tests to create a test plan. This should reduce the amount of code an user needs to write
to create a variety of test scenarios. From a basic set of test methods, different sequences
and tests can be created using Jmeter's GUI.
For example:
Test Plan1
• TestCase1.testImportCustomer
• TestCase2.testUpdateRandomCustomer
• TestCase1.testSelect100
• TestCase2.testUpdateOrder
• TestCase1.testSelect1000
TestPlan2
• TestCase1.testImportCustomer
• TestCase1.testSelect100
• TestCase1.testSelect1000
• TestCase2.testAdd100Customers
General Guidelines
Here are some general guidelines for writing Junit tests so they work well with Jmeter. Since
Jmeter runs multi-threaded, it is important to keep certain things in mind.
1. Write the setUp and tearDown methods so they are thread safe. This generally means
avoid using static memebers.
2. Make the test methods discrete units of work and not long sequences of actions. By
keeping the test method to a descrete operation, it makes it easier to combine test
methods to create new test plans.
3. Avoid making test methods depend on each other. Since Jmeter allows arbitrary
sequencing of test methods, the runtime behavior is different than the default Junit
behavior.
4. If a test method is configurable, be careful about where the properties are stored. Reading
the properties from the Jar file is recommended.
5. Each sampler creates an instance of the test class, so write your test so the setup happens
in oneTimeSetUp and oneTimeTearDown.
6. If you select a class and no methods show up, it means the sampler had a problem
creating an instance of the test class. The best way to debug this is to add some
System.out to your class constructor and see what is happening.
No comments:
New comments are not allowed.